MaDGIC provides access to various software programs, tools and equipment to collect, process, analyze, visualize and manage qualitative and quantitative research data. Our team can help you
- decide which analysis tools and software are best suited to help you achieve your learning, teaching and research goals
- create and manage ArcGIS Online accounts and content for students, staff and faculty
- install, set up and use various GIS and statistical software packages
- find online training and resources based on your needs and goals
- develop, run, and troubleshoot geospatial and statistical workflows in select software packages.
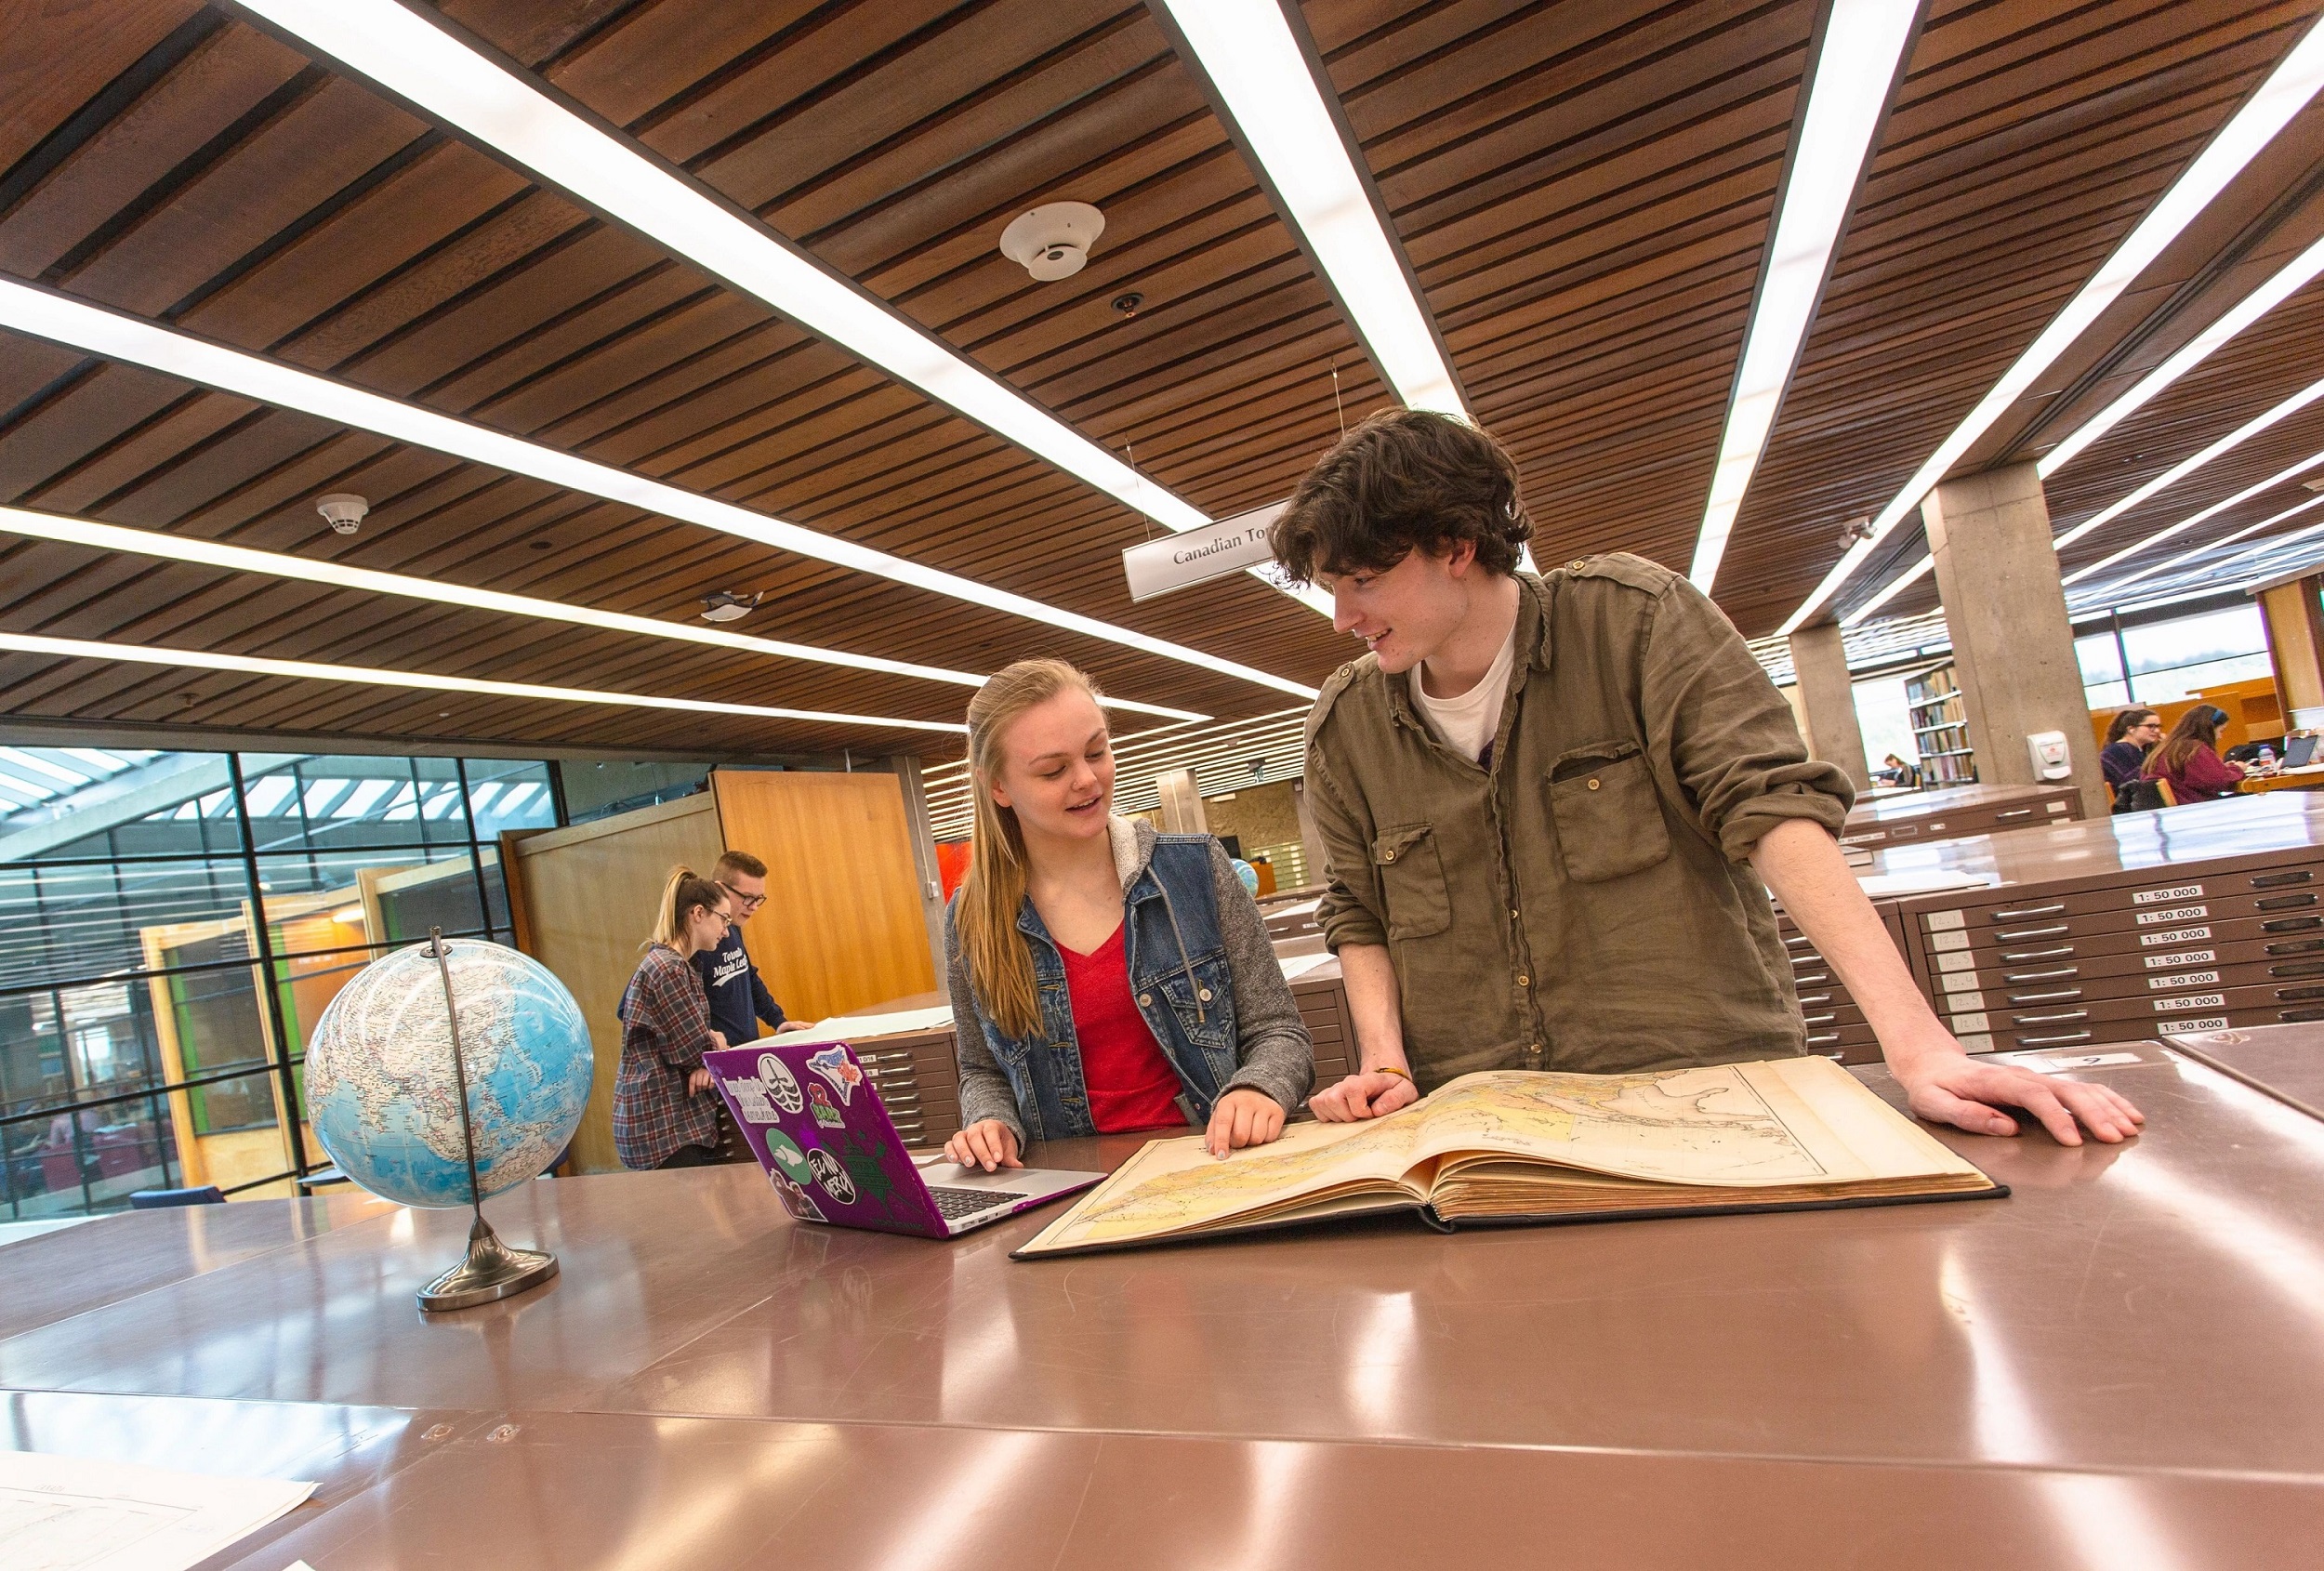
We maintain spaces and software to support advanced data processing and analysis in specialized software, including our Data Visualization Lab located in Bata Library and our Data Visualization Workstation located in Trent Durham Library & Learning Centre. Find more information about our spaces and supported technology using the menus below.
We provide Trent Esri Enterprise accounts to students, staff, and faculty to access Esri's suite of education products including ArcGIS Online, ArcGIS Pro, and Esri Academy.
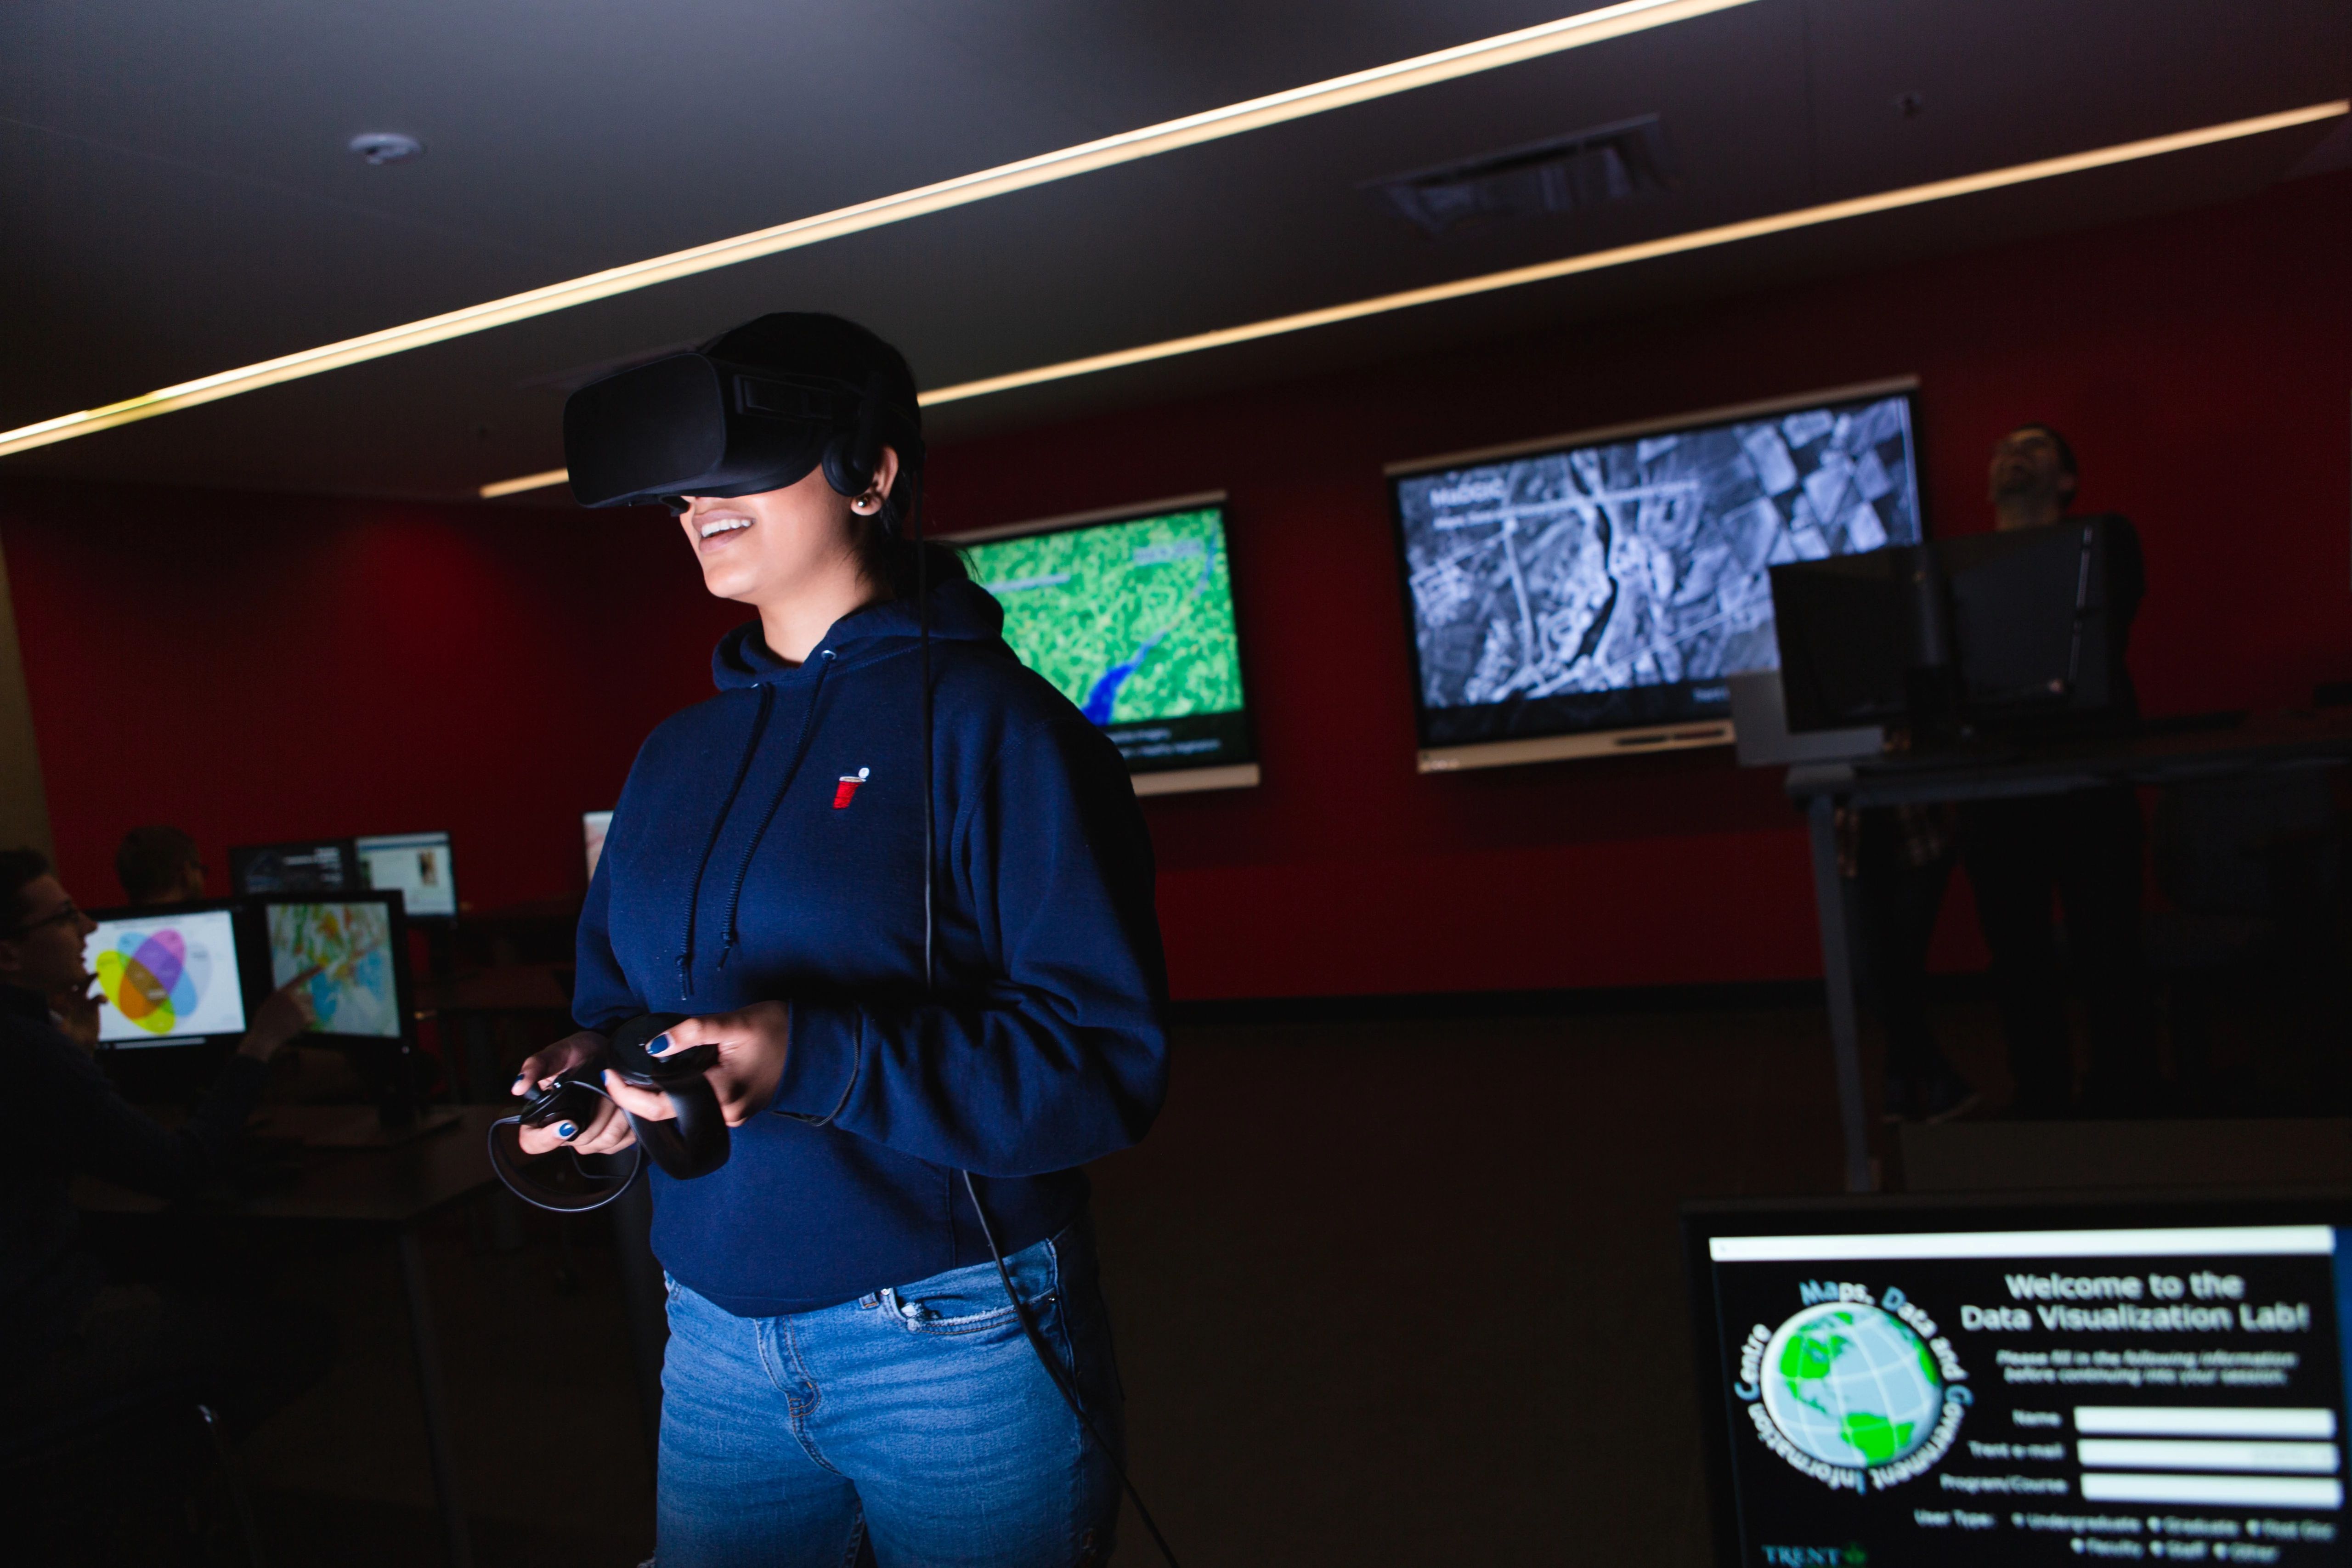
We provide access to the VR and Digitization workroom, located in Bata Library room 416, where students, staff, and faculty can use our large format scanner, NVIDIA 3D Vision Wireless Glasses, Oculus VR heatsets, and Trimble GPS unit.
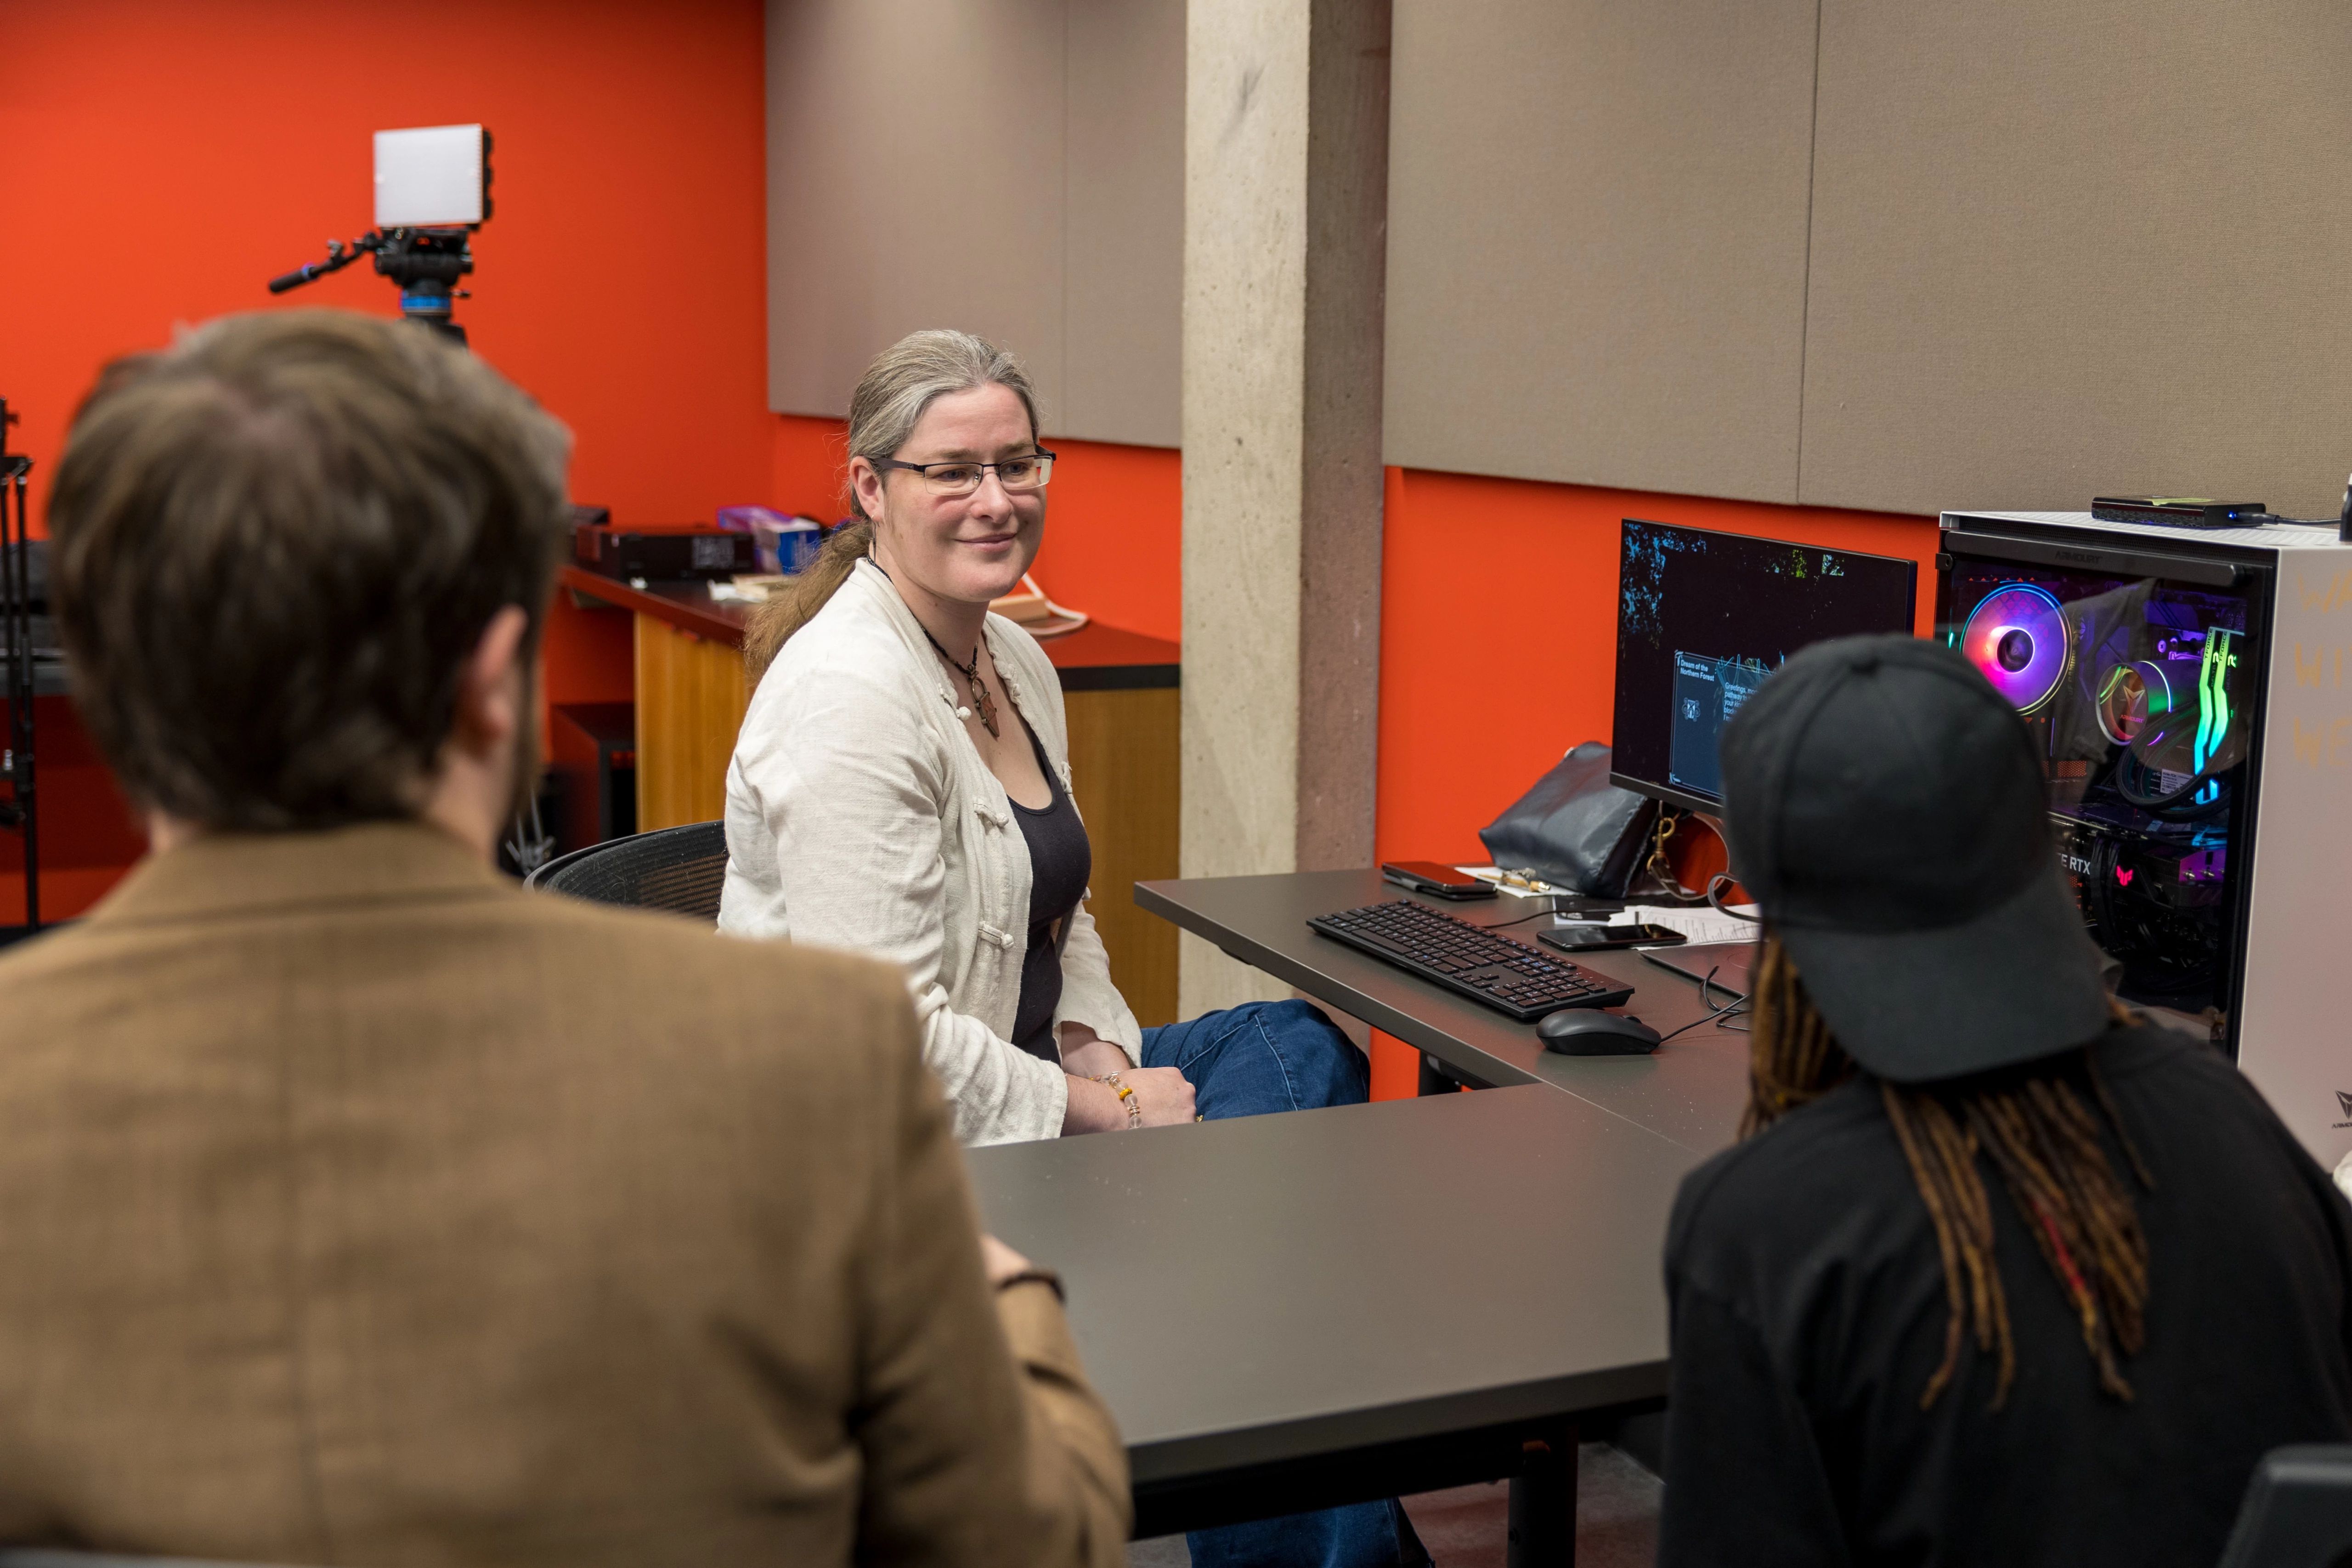
The Data Visualization (DV) Lab, part of the Moore Innovation Hub, is a facility for registered students, staff, and faculty to use advanced computing power and specialized software for spatial, quantitative, and qualitative data analysis and visualization.