Located at 44° north latitude and in the Great Lakes basin in eastern North America, Peterborough’s climate is qualitatively described as cold, temperate continental with warm summers. It is influenced by dominantly westerly winds, but air masses bringing warm/cold, wet/dry weather can originate from all cardinal directions. Its proximity to the Great Lakes has a moderating effect on temperature and can influence precipitation mostly in the form of lake effect events during winter.
Quantitatively, the most common way to show the climate of a place is with a climate diagram. Monthly average temperatures and monthly total precipitation are depicted on a graph that show features of seasonality. Peterborough’s climate diagram shows a strong seasonality in temperature, where the coldest month (January) averages –8.4°C and the warmest month (July) is 20.7°C. The mean annual temperature is 6.9°C. In contrast, precipitation shows less seasonality, with slightly less precipitation in the winter months than in the other seasons, but in general monthly totals range between 60 and 90 mm. Annually, the station receives 882 mm of precipitation, with approximately 15% falling as snow. A more detailed discussion of the climate of Peterborough is available in the Trent Geography department publication “Peterborough and the Kawarthas.”

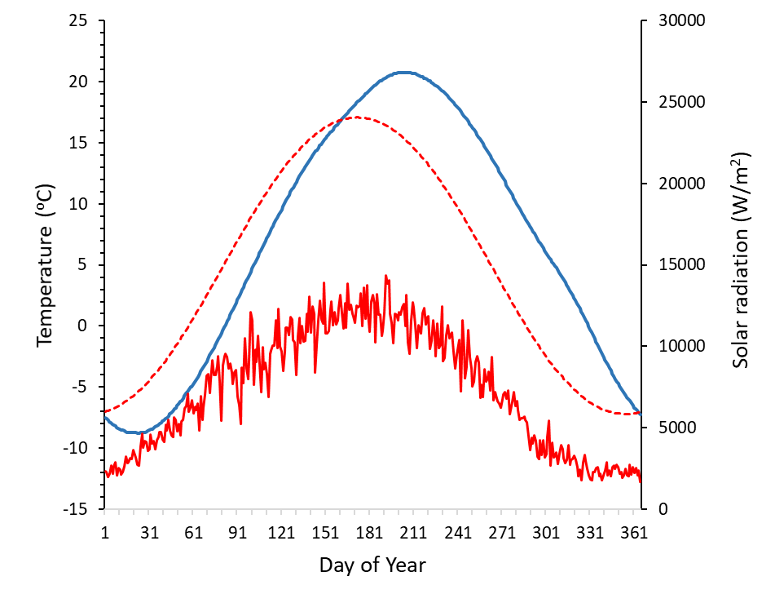
The plot below shows the annual cycles of temperature and solar radiation for the Trent station. The red lines show trends in solar radiation, the amount received at the surface of the earth (solid line) and the amount that enters the top of the atmosphere (TOA) over the site (dashed line). The amount received at the surface is much lower than at TOA because of the influence of clouds and absorption in the atmosphere. The minimum annual amount occurs on the winter solstice (~Dec. 22) and the maximum occurs at the summer solstice (~June 22). The temperature (blue line) shows the expected pattern, coldest in the winter months and warmest in summer. Interestingly, the temperature is out of phase with radiation by about 1 month, meaning that temperature minimums and maximums occur 1 month after the corresponding solar values. This ‘thermal lag’ is caused by the heat capacity of the earth-atmosphere system, which requires time to transmit radiation energy absorbed at the surface into the atmosphere.

Long term weather measurements have been made in the Peterborough area for more than 150 years. The long term record of monthly temperatures and precipitation were originally compiled with data from the various local stations by Dr W.P. Adams of the Trent Geography department in a departmental publication called “Climatological Record of Peterborough”. The historical record has been extended to current day using data from the Trent climate station. The plots below show annual average temperature and total precipitation for the period 1866-2022. Although there is high year-to-year variability and at the decadal scale, temperatures show a statistically significant increase over time, equivalent to ~0.084°C/ decade. Precipitation shows long term modulation between wetter and drier periods at the scale of 1-2 decades, but does not have any statistically significant long-term trend.


